Accounting Ratios: Liquidity, Profitability, Leverage & Activity
Accounting ratios are compact indicators that summarise financial statement information into measures you can use to judge a company’s short-term strength, profitability, capital structure and operating efficiency. This guide explains the main categories of accounting ratios, liquidity, profitability, leverage and activity/efficiency, what each category tells you about a business, and how managers, investors and lenders typically use these measures when making decisions. You will learn the practical purpose behind each category, the kinds of conclusions you can draw from movements in ratio values, and the limitations to watch for when interpreting ratios. Understanding ratios helps stakeholders convert balance sheet and income statement line items into actionable insights: whether the firm can meet near-term obligations, how well core operations convert sales into profit, how much financial risk arises from borrowing, and how effectively the business uses its assets and working capital. This guide focuses on conceptual clarity so you can apply ratio analysis in real situations, choosing which ratios to track, how to compare ratios over time or across peers, and how to avoid common pitfalls that can mislead decision-making. Read on to get a clear framework for using accounting ratios as part of financial analysis and business planning.
Liquidity Ratio
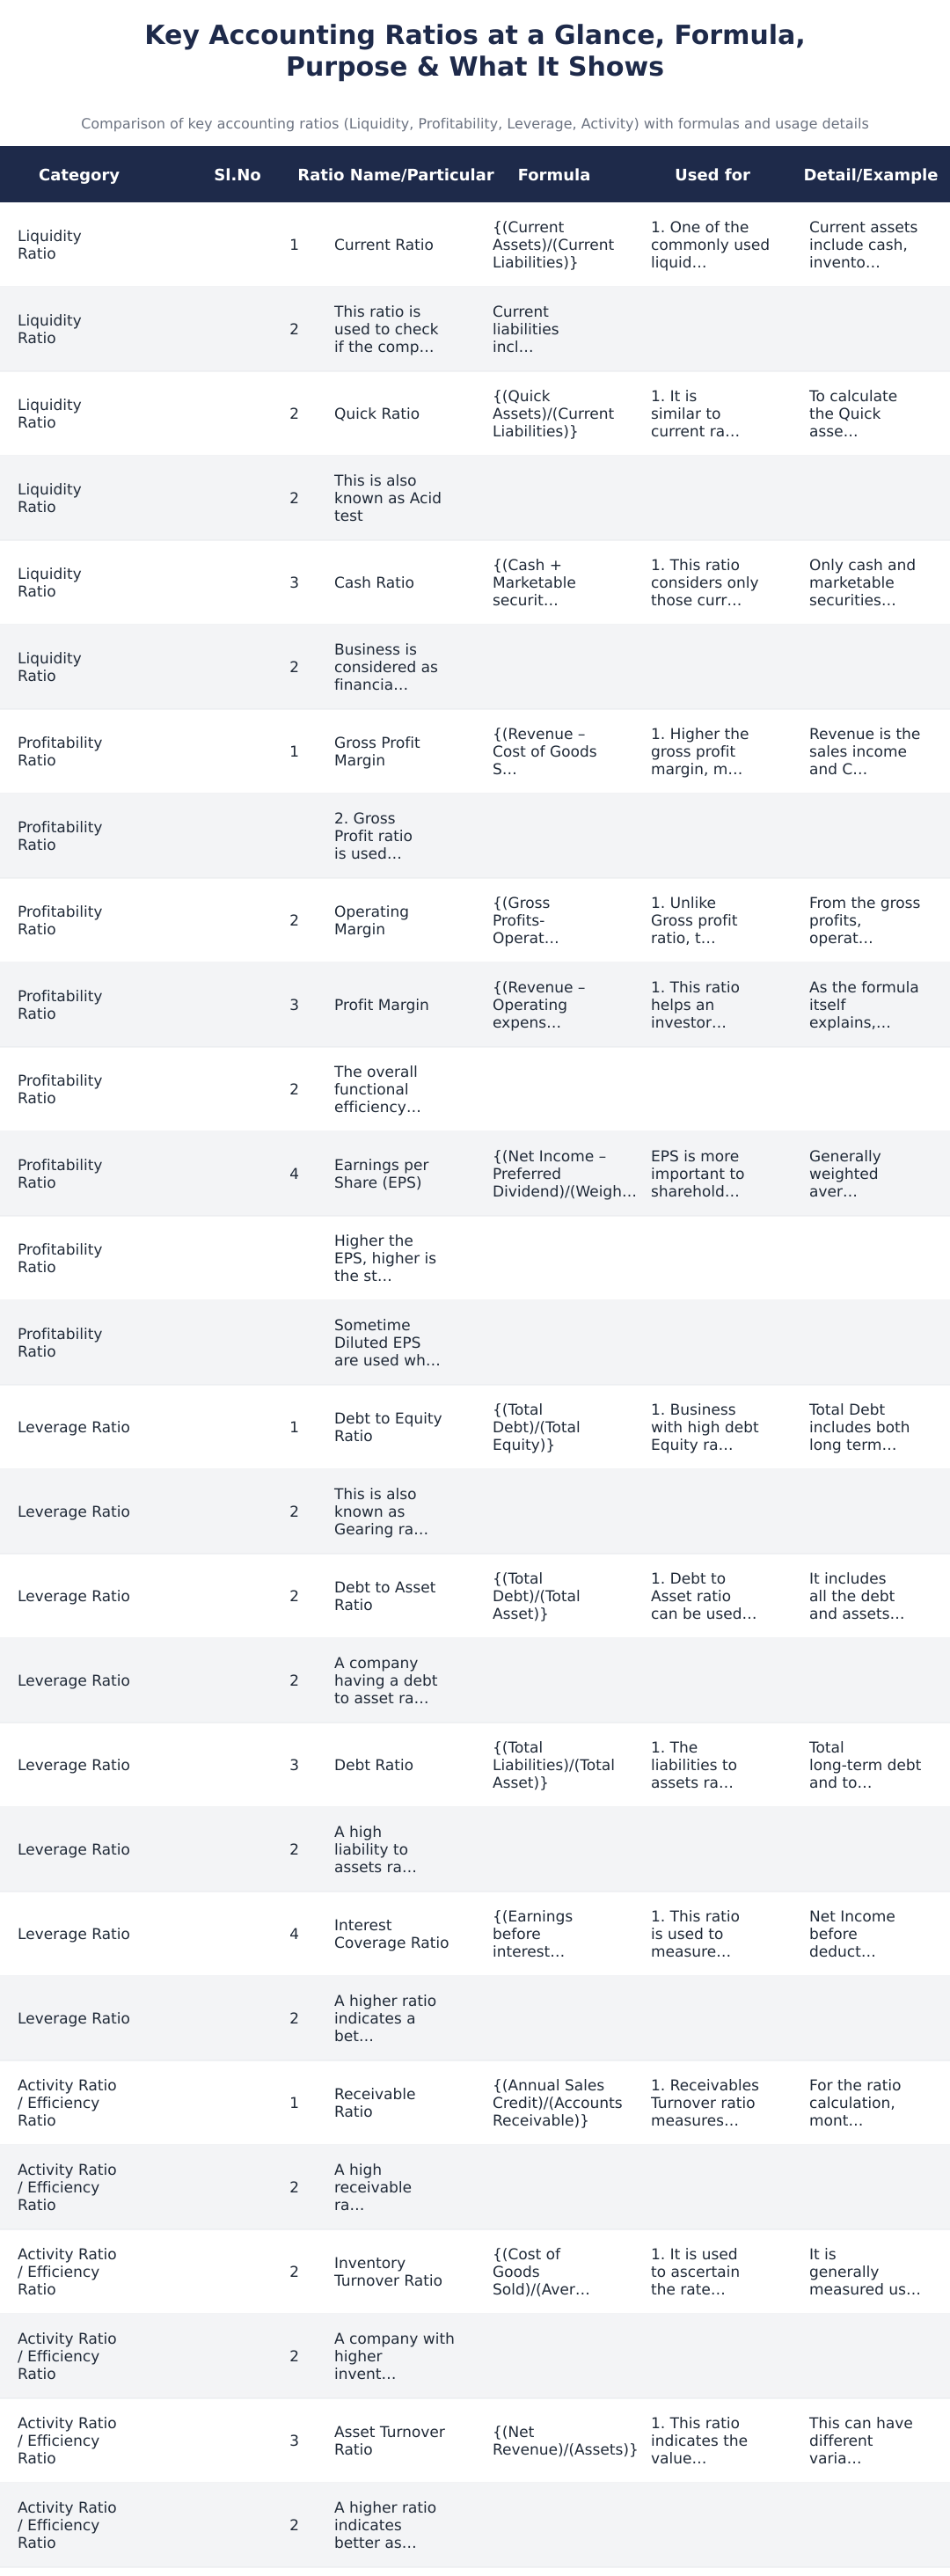
Liquidity ratios measure a company’s capacity to meet its short-term obligations using its short-term resources. They focus on the relationship between assets that are expected to convert to cash within a short period and liabilities that are due within the same timeframe. Analysts use liquidity measures to assess the risk that a firm will face cash shortfalls, and creditors pay close attention to liquidity when deciding on short-term lending or trade credit terms.
Interpreting liquidity ratios requires context. A firm with ample liquid resources relative to its near-term liabilities is less likely to face forced asset sales or payment delays, while a consistently low liquidity position may signal refinancing needs or working capital strain. However, excessively high liquidity can also indicate inefficient use of capital if funds are idle rather than invested in productive opportunities. Therefore, liquidity analysis is most informative when compared with historical trends, budgeted needs, and peer companies operating in the same industry.
Profitability Ratio
Profitability ratios evaluate how effectively a business converts sales and other income into profit after covering costs. These ratios can be calculated at different layers of the income statement, focusing on margins from core production, margins after operating costs, and margins after all expenses, to give a layered view of performance. Investors and management use profitability measures to assess operational efficiency, pricing strategy, cost control and overall return on the enterprise.
When using profitability ratios, compare across time periods and against comparable firms in the same sector. Changes in margin levels often point to underlying developments such as shifts in input costs, changes in product mix, pricing pressures, or changes in operating leverage. Profitability analysis should be combined with qualitative information, like market conditions and management initiatives, to understand whether margin changes are temporary or structural.
Leverage Ratio
Leverage ratios gauge the extent to which a firm relies on borrowed funds versus owners’ equity to finance its assets. These measures signal financial risk: higher reliance on debt increases the firm’s fixed payment obligations and can amplify returns in good times but also heighten bankruptcy risk in downturns. Creditors, rating agencies and conservative investors closely monitor leverage as part of assessing solvency and long-term viability.
Interpreting leverage requires looking beyond a single ratio. The maturity profile of debt, interest rate exposure, availability of liquidity buffers and the stability of earnings all influence how much leverage is sustainable. A moderate level of borrowing can support growth and tax-efficient capital structure, while excessive leverage relative to earnings stability can constrain strategic flexibility and raise refinancing risk.
Activity Ratio / Efficiency Ratio
Activity or efficiency ratios assess how well a company uses its assets and manages working capital to generate revenue. Typical concerns addressed by these ratios include how quickly receivables are collected, how rapidly inventory turns into sales, and how effectively fixed assets are used to produce revenue. Efficiency analysis helps identify operational bottlenecks, opportunities to free up cash, and areas where process improvements can raise returns without additional capital.
As with other ratio categories, context is crucial. Industry characteristics and business model differences mean that what counts as a good efficiency metric in one sector may be normal or poor in another. Trend analysis and peer benchmarking reveal whether changes stem from improved processes or from temporary disruptions. Efficiency ratios are especially valuable when combined with cash flow metrics, because high reported revenue does not always translate into cash if working capital is poorly managed.
Accounting ratios are powerful diagnostic tools when used thoughtfully: choose the right ratios for your purpose, compare them over time and with peers, and always interpret them alongside cash flows and qualitative business information. No single ratio tells the whole story; together they form a balanced picture of liquidity, profitability, leverage and operating efficiency that supports better financial decisions.
Frequently asked questions
What is the current ratio and what does it tell me about a company’s short-term liquidity?
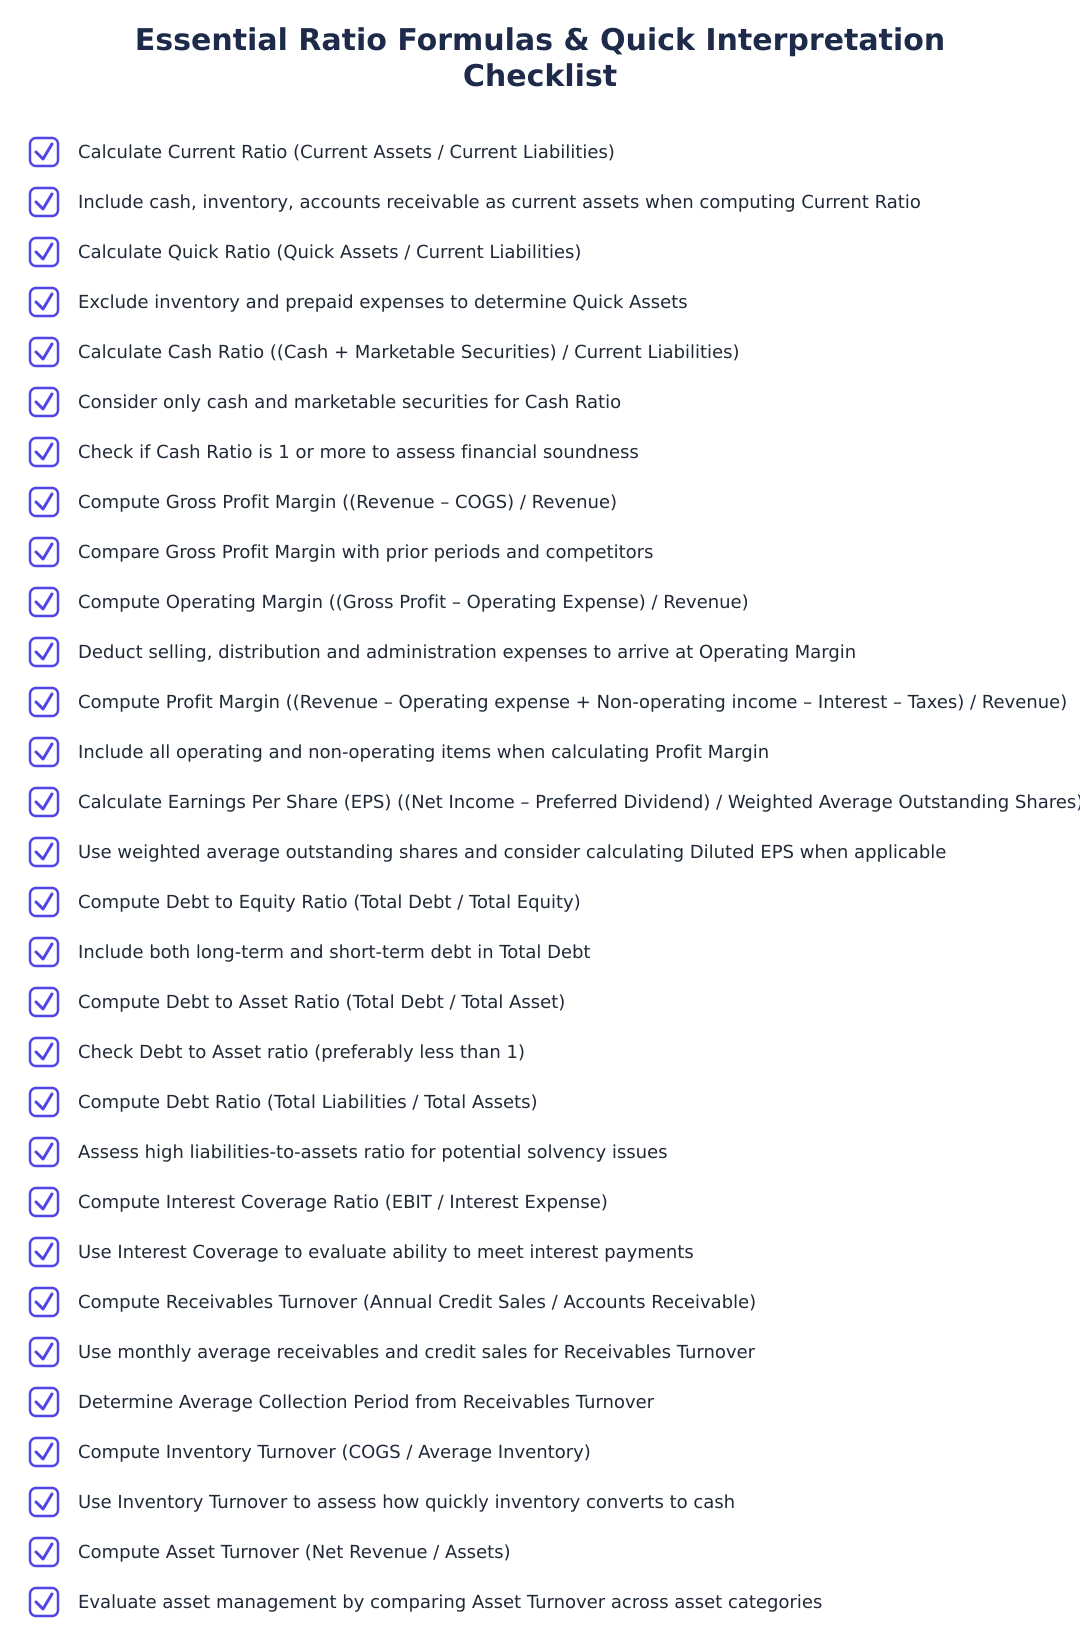
The current ratio is a liquidity measure equal to current assets divided by current liabilities and it shows whether a company can pay debts due within the next 12 months. Current assets include cash, inventory and accounts receivable while current liabilities include accounts payable and income tax payable; a higher ratio generally indicates better short-term liquidity. It is commonly used to compare a company’s position over time or against peers, but it can be distorted if inventory is large and hard to convert to cash. For a quick check, use the quick ratio to remove less liquid items like inventory and prepaid expenses.
How is the quick ratio different from the current ratio and when should I use it?
The quick ratio (acid test) is current quick assets divided by current liabilities and excludes inventory and prepaid expenses to focus on easily liquidatable assets. It is used when you want a stricter test of short-term liquidity because inventory and some current assets may be hard to convert to cash quickly. Quick assets typically include cash, marketable securities and receivables; use it when you suspect inventory can’t be sold quickly or when assessing cash-backed solvency. Unlike the current ratio, a low quick ratio signals potential difficulty meeting immediate obligations even if the current ratio looks fine.
What does the cash ratio mean and what benchmark indicates financial soundness?
The cash ratio is (cash + marketable securities) divided by current liabilities and measures the most conservative short-term liquidity available to pay debts immediately. Only cash and marketable securities are considered as current assets in this ratio, and a cash ratio of 1 or more is generally considered financially sound because it means immediate obligations can be met solely with cash-like assets. This ratio is useful for crisis or worst-case analysis but can understate liquidity for firms that reliably convert receivables or inventory to cash. Use it alongside current and quick ratios for a full liquidity picture.
What is gross profit margin and why is it important?
Gross profit margin is (Revenue − Cost of Goods Sold) divided by Revenue and it indicates how efficiently a company produces goods relative to sales. A higher gross profit margin means the business retains more money from each rupee of sales after covering direct production costs like raw materials and labour, and it’s useful for comparing performance over periods or with competitors. It doesn’t include operating or non-operating expenses, so use operating margin or profit margin to see profitability after those costs. For example, rising gross margin over time suggests improved production efficiency or pricing power.
How do operating margin and profit margin differ and when should I use each?
Operating margin is (Gross Profit − Operating Expenses) divided by Revenue and measures profitability from core business operations, while profit margin is (Revenue − Operating Expense + Non‑Operating Income − Interest − Taxes) divided by Revenue and shows profitability after all operating and non‑operating items. Use operating margin to judge operational efficiency because it includes selling, distribution and administrative expenses; use profit margin to understand overall return on revenue after interest, taxes and other non‑operating items. Operating margin will typically be higher than profit margin when interest or taxes are significant; investors look at profit margin to see how much net income is generated per rupee of revenue.
What is Earnings Per Share (EPS) and why do investors care about it?
Earnings Per Share (EPS) is (Net Income − Preferred Dividends) divided by the weighted average outstanding shares and it shows the profit attributable to each equity share. EPS is important to shareholders because higher EPS generally supports a higher stock price and gives a per‑share view of profitability; companies often report basic and diluted EPS, with diluted EPS including the effect of options, convertibles and warrants. Using the weighted average shares accounts for changes in outstanding shares during the period, which gives a more accurate per‑share number. Investors compare EPS across periods and to peers to evaluate earnings growth and valuation.
What do debt-to-equity, debt-to-asset and debt ratios tell me about leverage?
Debt-to-equity (Total Debt/Total Equity), debt-to-asset (Total Debt/Total Asset) and debt ratio (Total Liabilities/Total Asset) quantify how much a company relies on debt versus equity or assets and indicate financial leverage and solvency risk. A high debt-to-equity ratio suggests the business depends more on borrowing for operations, while a debt-to-asset ratio below 1 is generally better for investment and ratios above 1 indicate high leverage; the debt ratio shows the portion of assets financed by liabilities and a high value signals potential solvency issues. Total debt includes both short‑term and long‑term borrowings and total assets include tangible and intangible items, though some analyses use variations excluding certain items. Creditors and investors use these ratios to assess risk, and acceptable levels vary by industry.
What is interest coverage ratio and how does it measure a company's ability to pay interest?
Interest coverage ratio is Earnings Before Interest and Taxes (EBIT) divided by Interest Expense and measures a company’s ability to meet interest payments from operating earnings. A higher interest coverage ratio indicates a better financial position because the company earns significantly more than its interest obligations; conversely, a low ratio signals potential difficulty servicing debt. EBIT is used because it reflects operating earnings before financing costs, and lenders often look for comfortably high coverage multiples depending on industry risk. If the ratio falls toward 1 or below, the firm may struggle to pay interest without reducing principal or refinancing.
What are receivable turnover, inventory turnover and asset turnover ratios used for?
Receivable turnover (Annual Credit Sales / Accounts Receivable), inventory turnover (Cost of Goods Sold / Average Inventory) and asset turnover (Net Revenue / Assets) measure how efficiently a company converts receivables, inventory and assets into sales or cash. High receivable turnover indicates efficient collections and can be used to compute average collection period; high inventory turnover shows effective sales and inventory management, while high asset turnover reflects good utilization of investment to generate revenue. These ratios are usually compared over time or with peers and can be calculated using monthly averages for receivables or average inventories for more accuracy. Different variants exist (e.g., using specific asset categories for asset turnover) so use the version that matches your analysis goal.
Need help staying Accounting compliant?
MoneyGence's AI Finance OS tracks your compliance, wallet share, and finances in one place, built for agencies and growing businesses.
Get started with MoneyGence